Causal Capybara

Open source causal inference software for Windows. Design a study, inspect assumptions and diagnostics, compare treatment-effect estimates and export scripts and reports. A command-line analysis workflow and separate offline research service are also available.

Open source · Windows app v0.2.0 · Python included

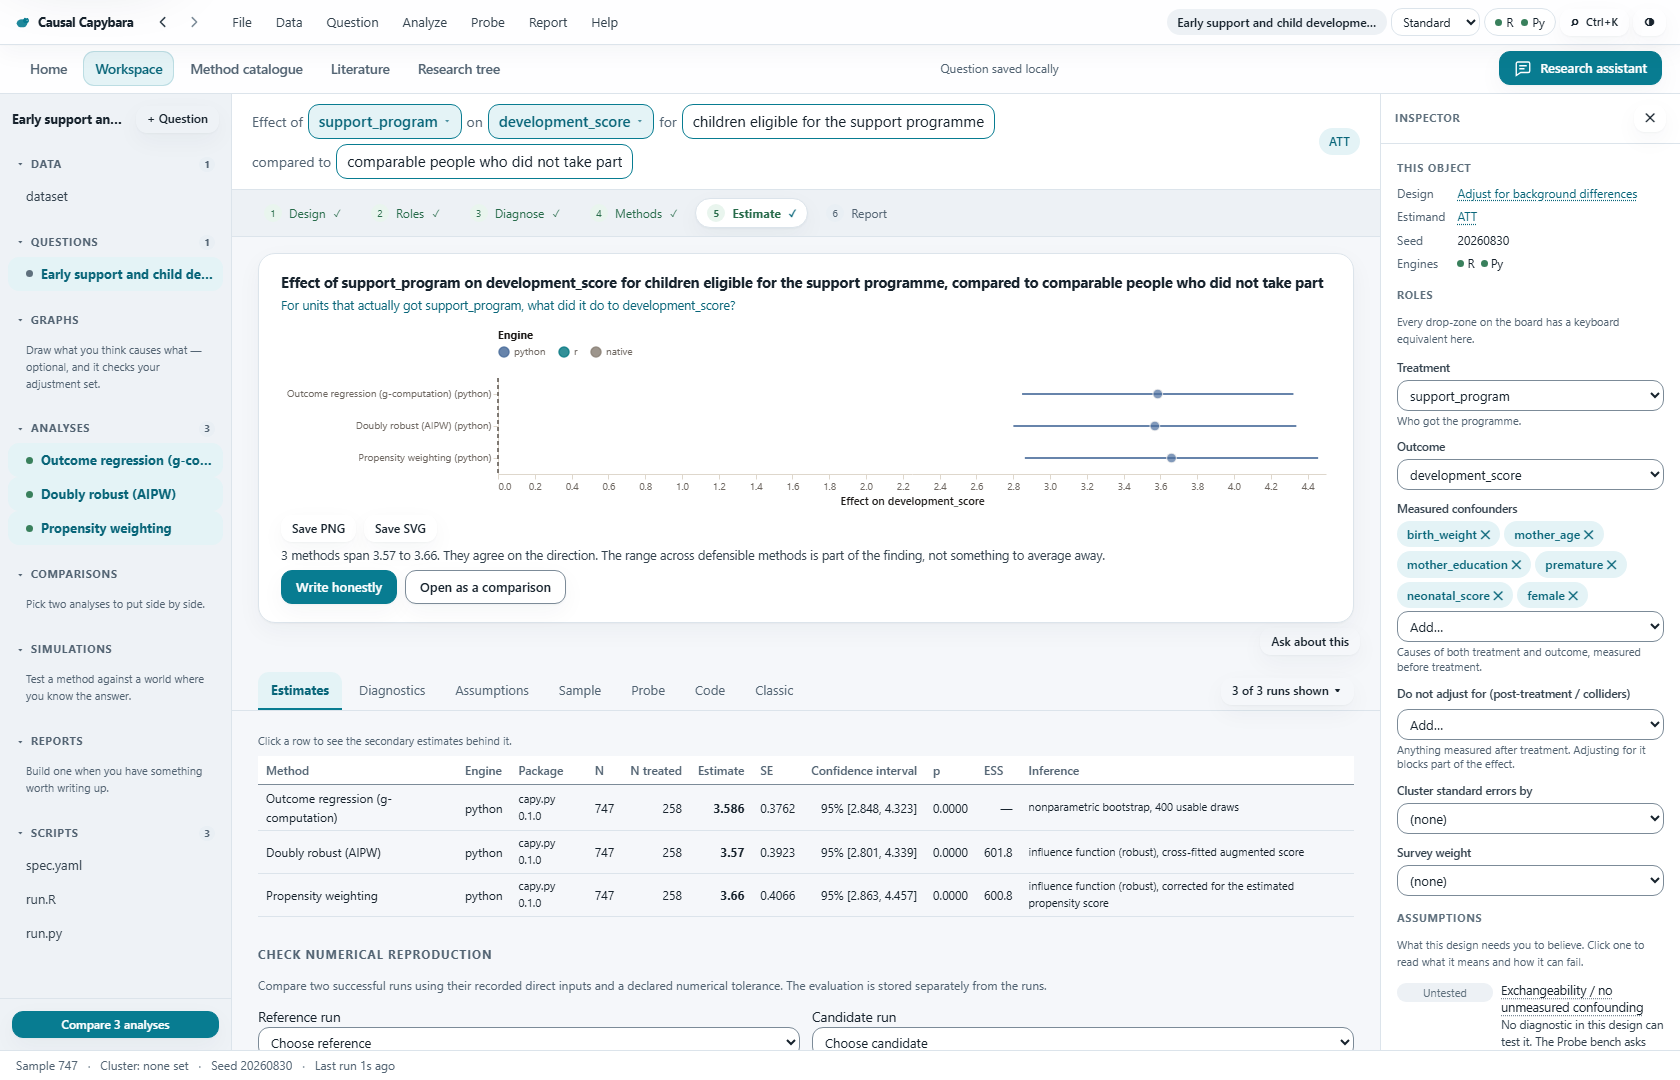
Causal Capybara comparing three Python treatment-effect estimates and confidence intervals, with the research question, selected variables and assumptions visible alongside.
Actual Python results on generated teaching data. View full size

Research workflow

  1. Frame the question

    Name the treatment, outcome, population and comparison. Choose the effect you want to estimate before choosing the estimator.

  2. Make the design explicit

    Choose from ten research designs. Assign variables on the design board, draw a causal graph and keep post-treatment controls out of your adjustment set.

  3. Inspect, then estimate

    Work through 119 diagnostics covering overlap, balance, trends and more. Compare defensible methods side by side and keep uncertainty visible.

  4. Take the reasoning with you

    Export the specification, generated R/Python code, plots and reports. Assumptions, sample exclusions and provisional results travel with the analysis.

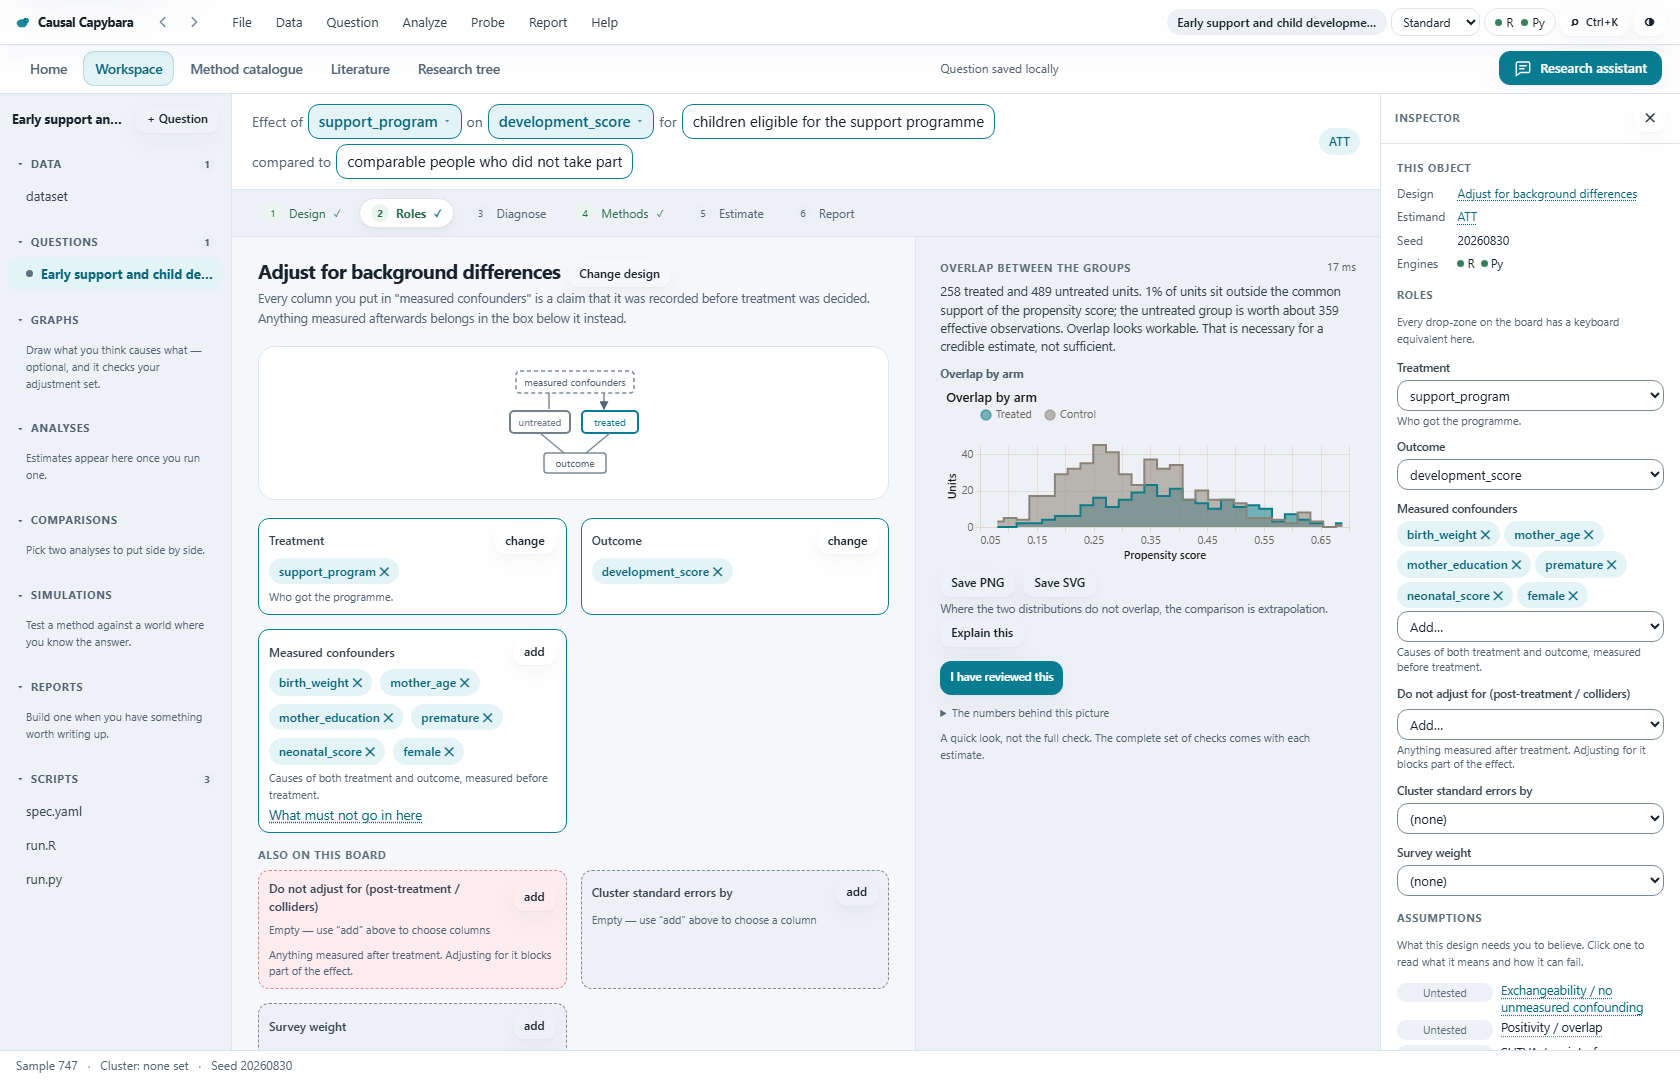
The research design board assigns treatment, outcome and measured confounders and shows a computed overlap diagnostic.
The design board makes your identification choices visible.

Assumptions and diagnostics

The assumptions ledger keeps the distinction between assumed, supported and untested visible. Good balance does not establish that every confounder was measured.

Sample changes have reasons. Unreviewed core diagnostics leave a provisional flag. When methods disagree, the comparison stays in view.

If you need help designing a study, explore our policy and programme evaluation service.

Read the analysis guide

Method catalogue

Browse all 93 registered methods and probes. 70 run on the Python engine; 23 are teaching cards that explain methods whose adapters are not yet included. Seven runnable methods also have an R adapter.

93 methods and probes

Randomised experiments7 entries
  • Interference and spillovers

    Teaching card

    When one unit's treatment affects another's outcome, estimate the direct and spillover effects separately instead of pretending neither exists.

    interference.exposure
  • ITT and CACE (noncompliance)

    Python

    Not everyone offered a programme takes it. Report what the offer did, and separately what taking it up did for the people it moved.

    rct.cace
  • Cluster-randomised trial

    Python

    When whole schools, clinics or villages were assigned, the number of clusters is the sample size that matters.

    rct.cluster
  • Difference in means

    Python + R

    Compare the two arms as they were randomised, and let covariates sharpen the comparison without letting them change the question.

    rct.diff_means
  • Randomisation (Fisher) inference

    Python

    Re-run the randomisation thousands of times with the outcomes held fixed, and see how unusual what actually happened really is.

    rct.randomization_inference
  • Blocked or stratified experiment

    Python

    Estimate inside the blocks the randomisation was run in, then average them the way your estimand says to.

    rct.stratified
  • Transportability and generalisability

    Teaching card

    Take an effect estimated in one population and ask what it would be in another with a different mix of characteristics.

    transport.generalize
Observational adjustment & causal machine learning20 entries
  • Manski bounds

    Teaching card

    Report the range the effect must lie in given only what the data can support, without assuming away the missing counterfactual.

    bounds.manski
  • Structure learning (causal discovery)

    Teaching card

    Search for a graph consistent with the data. It does not recover the true causal structure from observational data without extra assumptions.

    discovery.structure_learning
  • Honest causal forest

    Python + R

    Grow trees that look for units whose effect differs, keeping the rows that chose each split away from the rows that estimate it.

    ml.causal_forest
  • Double ML (interactive)

    Python

    A separate outcome model for each arm plus a treatment model, combined in a doubly robust score: right if either side is right.

    ml.dml_irm
  • Double ML (partially linear)

    Python

    Predict the outcome and the treatment from the confounders, then regress what is left of one on what is left of the other.

    ml.dml_plr
  • Meta-learner (T, S, X, DR)

    Python

    Build the per-unit effect out of ordinary prediction models, four different ways, on the same cross-fitting.

    ml.metalearner
  • Policy tree (who should be treated)

    Python

    Learn a short, readable rule for who to treat, then value that rule on data it never saw.

    ml.policy_tree
  • Doubly robust (AIPW)

    Python + R

    Use a treatment model and an outcome model together; it is right if either one is.

    obs.aipw
  • Coarsened exact matching

    Python

    Bin the covariates, then compare only inside bins that contain both arms.

    obs.matching.cem
  • Genetic matching

    Teaching card

    Search over distance-metric weights until balance is as good as it can get, instead of trusting one metric.

    obs.matching.genetic
  • Nearest-neighbour matching

    Python

    Pair each treated unit with the most similar untreated unit, then compare within pairs.

    obs.matching.nn
  • Optimal and full matching

    Teaching card

    Choose the whole set of matches at once to minimise total distance, rather than greedily one treated unit at a time.

    obs.matching.optimal
  • Multiple imputation compatible with the analysis

    Teaching card

    Impute the missing values several times, run the analysis in each, and combine -- instead of dropping every row with a gap.

    obs.missing.mice
  • Outcome regression (g-computation)

    Python + R

    Model the outcome, then ask what would have happened if everyone had been treated, and if nobody had.

    obs.outcome_regression
  • Super Learner nuisance models

    Teaching card

    Combine several candidate learners by cross-validated weights instead of betting on one.

    obs.superlearner
  • Targeted maximum likelihood (TMLE)

    Python

    Fit the outcome model, then nudge it once in the direction the treatment model says it is wrong.

    obs.tmle
  • Covariate balancing propensity score

    Teaching card

    Fit the treatment model so that it balances covariates, rather than fitting it to predict treatment and hoping balance follows.

    obs.weighting.cbps
  • Entropy balancing

    Python

    Find the weights closest to equal that make the covariate means match exactly.

    obs.weighting.entropy
  • Propensity weighting

    Python + R

    Reweight the sample so the treated and untreated groups look alike on the measured confounders.

    obs.weighting.ipw
  • Boosted propensity scores (twang)

    Teaching card

    Grow a boosted model for the propensity score, stopping at the iteration that balances covariates best.

    obs.weighting.twang

Difference-in-differences13 entries
  • Imputation (Borusyak-Jaravel-Spiess)

    Python

    Learn what untreated life looks like from untreated cells only, then ask how far each treated cell landed from it.

    did.bjs_imputation
  • Callaway & Sant'Anna group-time effects

    Python

    Estimate one clean before-and-after for every adoption cohort, then say out loud how you averaged them.

    did.callaway_santanna
  • de Chaisemartin & D'Haultfoeuille

    Teaching card

    An estimator built for panels where treatment switches on and off, which the imputation and cohort estimators assume never happens.

    did.chaisemartin
  • Doubly robust DiD

    Python

    One before-and-after with covariates, using an outcome model and a comparison-group model together so either one can carry it.

    did.dr_did
  • Event study (leads and lags)

    Python

    Plot the effect period by period around adoption, so you can see whether the gap opened when the policy arrived or long before it.

    did.event_study
  • Two-stage DiD (Gardner / Wooldridge-Mundlak)

    Python

    Strip out unit and period effects using untreated cells only, then regress what is left on the policy.

    did.gardner_2s
  • Goodman-Bacon decomposition

    Python

    Open up a two-way fixed effects estimate and show every two-group comparison inside it, with the weight each one carries -- including the ones that use already-treated units as controls.

    did.goodman_bacon
  • Matched difference-in-differences

    Teaching card

    Match treated to comparison units on pre-period characteristics first, then difference.

    did.matched
  • Sun & Abraham event study

    Python

    Give every cohort its own event-study path, then average the paths by cohort size instead of letting the regression choose the weights.

    did.sun_abraham
  • Synthetic difference-in-differences (synthdid)

    Teaching card

    Weight both units and periods, then take a difference-in-differences -- halfway between synthetic control and DiD.

    did.synthdid_r
  • Triple differences

    Python

    Compare the treated-versus-comparison difference for the group the policy could reach with the same difference for a group inside the same units that it could not.

    did.triple_diff
  • Two-way fixed effects

    Python + R

    One regression with unit and period fixed effects. Familiar, fast, and not an average treatment effect when units adopt at different dates.

    did.twfe
  • Difference-in-differences (2x2)

    Python + R

    Two groups, two periods: compare how much the treated group changed with how much the comparison group changed over the same window.

    did.twoway_2x2
Regression discontinuity7 entries
  • Do the covariates jump at the cutoff too?

    Python

    Run the same estimator on variables the programme cannot have changed; they should not step at the threshold.

    rd.covariate_balance
  • Did people sort across the cutoff?

    Python

    Compare how many units sit just below the threshold with how many sit just above.

    rd.density_test
  • Fuzzy RD (crossing the cutoff only nudged people in)

    Python

    Divide the jump in the outcome by the jump in take-up: the effect for the people the cutoff actually moved.

    rd.fuzzy
  • Regression kink (the rule bends, it does not switch)

    Python

    Where a formula changes slope rather than switching on, measure the change in slope of the outcome.

    rd.kink
  • Sharp RD at the cutoff

    Python

    Fit a line either side of the threshold and measure the step between them.

    rd.local_linear
  • Local randomisation RD

    Teaching card

    Treat a narrow window around the cutoff as a small randomised experiment rather than fitting a curve through it.

    rd.local_randomization
  • Multi-cutoff and geographic RD

    Teaching card

    Several thresholds, or a boundary on a map, pooled into one design.

    rd.multi_cutoff
Instrumental variables6 entries
  • Two-stage least squares

    Python

    Use only the part of the treatment that the instrument moved, and see what happened to the outcome.

    iv.2sls
  • Two-step GMM

    Python

    Weight the instruments by how informative each one actually is, using a weight matrix estimated from the data.

    iv.gmm
  • LIML (and Fuller)

    Python

    The maximum-likelihood cousin of two-stage least squares, which stays much better behaved when the instruments are weak.

    iv.liml
  • Marginal treatment effects

    Teaching card

    Trace the effect as a function of how reluctant a unit is to be treated, instead of reporting one local average.

    iv.mte
  • Shift-share (Bartik) instruments

    Teaching card

    Combine national shocks with local exposure shares to build an instrument for local changes.

    iv.shift_share
  • Weak-instrument-robust confidence set

    Python

    Report the set of effects the data cannot reject, which stays honest however weak the instrument is.

    iv.weak_robust
Synthetic controls6 entries
  • Synthetic control

    Python

    Build a weighted copy of the treated place out of untreated places that looked like it beforehand, then watch the two lines separate.

    sc.abadie
  • Augmented synthetic control

    Python

    When no weighted average of the donors can match the treated place, correct the leftover bias with a ridge model and show the size of the correction.

    sc.augmented
  • Matrix completion

    Python

    Treat the missing treated-period outcomes as holes in a panel and fill them in with a low-rank model of what the panel would have done.

    sc.matrix_completion
  • Microsynth (many treated units)

    Teaching card

    Synthetic control when the treated unit is a neighbourhood or a small area and there are many of them.

    sc.microsynth
  • Prediction intervals for synthetic control (scpi)

    Teaching card

    Confidence intervals for a synthetic control that come from a model of the prediction error rather than from permutation.

    sc.scpi
  • Synthetic difference-in-differences

    Python

    Weight the comparison units and the pre-treatment periods, then run a difference in differences on the result - a level gap is allowed, a trend gap is not.

    sc.synthdid
Interrupted time series4 entries
  • ARIMA with an intervention

    Python

    Model the memory in the series itself, then ask how big a step, pulse or ramp the data need at the intervention date.

    its.arima
  • Bayesian structural time series (CausalImpact)

    Teaching card

    Model the counterfactual series with a structural time-series model and control series, and report a posterior rather than an interval.

    its.causal_impact
  • Controlled ITS

    Python

    The same interruption, measured against a series the intervention did not touch, so a shock that hit everybody is not booked as your effect.

    its.controlled
  • Segmented regression

    Python

    Fit the trend before the interruption, project it forward, and measure the jump and the change of direction after it.

    its.segmented
Mediation3 entries
  • Controlled direct effect

    Python

    What the treatment would still do if the mediator were fixed at one value for everybody.

    med.controlled_direct
  • Interventional direct and indirect effects

    Python

    Shift the mediator to the distribution it would have in the population, rather than to each person's own unobservable counterfactual.

    med.interventional
  • Natural direct and indirect effects

    Python

    Split the total effect into the part that travelled through the mediator and the part that did not.

    med.natural_effects
Longitudinal treatment6 entries
  • G-estimation of structural nested models

    Teaching card

    Estimate the effect of a treatment regime by finding the parameter that removes the association between treatment and the blipped-down outcome.

    long.g_estimation
  • Parametric g-formula

    Python

    Model each period in turn, then simulate the world where everyone followed the strategy you name.

    long.gformula
  • Longitudinal modified treatment policies (lmtp)

    Teaching card

    Estimate the effect of shifting a continuous or multi-valued treatment, rather than of setting everyone to one value.

    long.lmtp
  • Sequential doubly robust (ICE g-formula with augmentation)

    Python

    Regress backwards from the final outcome, then correct with the treatment probabilities: right if either set of models is right.

    long.ltmle
  • Longitudinal TMLE for survival outcomes

    Teaching card

    Time-to-event outcomes with time-varying treatment and censoring, targeted at each time.

    long.ltmle_survival
  • Marginal structural model (time-varying weights)

    Python

    Reweight each person-period so the treated and untreated histories look alike, then fit one simple model to the reweighted data.

    long.msm_iptw
Survival analysis3 entries
  • Censored AFT regression and causal standardization

    Python

    Fit a right-censored log-normal/Weibull AFT model; standardize survival/RMST over baseline covariates under explicit causal assumptions, or report a conditional time factor.

    survival.aft
  • Unadjusted Kaplan–Meier survival contrast

    Python

    Compare observed group event-free probabilities at an explicit common horizon; this is an unadjusted association.

    survival.kaplan_meier
  • Unadjusted restricted mean survival contrast

    Python

    Compare areas under observed Kaplan–Meier curves through a common horizon in time units; this is an unadjusted association.

    survival.rmst
Treatment heterogeneity4 entries
  • Binary outcome heterogeneity

    Python

    Logistic interactions plus separate standardized risk-difference, risk-ratio or marginal odds-ratio heterogeneity tests.

    heterogeneity.binary
  • Nominal and ordinal outcome heterogeneity

    Python

    Multinomial treatment interactions and a joint test of category-probability contrasts; preserves categories without assigning numeric scores.

    heterogeneity.categorical
  • Continuous outcome heterogeneity

    Python

    OLS treatment-by-baseline-modifier interactions with HC3 or cluster sandwich inference, direct mean-difference tests and Holm pairwise comparisons.

    heterogeneity.continuous
  • Count and rate outcome heterogeneity

    Python

    Poisson conditional-mean interactions with robust sandwich inference; compare standardized count or fixed-exposure rate contrasts.

    heterogeneity.count
Sensitivity & robustness probes14 entries
  • Unobserved confounder

    Python

    Simulate a common cause of a stated strength and watch the estimate move; read off how strong one would have to be to explain the result away.

    probe.add_unobserved_confounder
  • Specification curve

    Python

    Run the grid of defensible specifications and sort the answers. The curve is the result, not the one you happened to run.

    probe.alternate_spec
  • Cinelli-Hazlett sensitivity (partial R2)

    Python

    How strong would an unmeasured confounder have to be -- compared with the covariates you already have -- to explain the estimate away?

    probe.cinelli_hazlett
  • E-value

    Python

    The smallest confounder-treatment and confounder-outcome association that could explain the result away.

    probe.evalue
  • Honest DiD (Rambachan-Roth)

    Python

    What survives when parallel trends is allowed to fail by a stated amount.

    probe.honest_did
  • Leave one out

    Python

    Drop one cluster, cohort or donor at a time and see whether any single one is carrying the result.

    probe.leave_one_out
  • Negative control

    Python

    Estimate something that shares the confounding but not the causal path. A non-zero answer is bias you can see.

    probe.negative_control
  • Oster coefficient stability

    Python

    How important would unobserved variables have to be, relative to the controls you already have, to drive the coefficient to zero?

    probe.oster
  • Placebo outcome

    Python

    Run the same analysis on something the treatment could not have changed. It should find nothing.

    probe.placebo_outcome
  • Placebo treatment

    Python

    Move the policy date earlier, reshuffle who was treated, or swap in a variable that cannot cause the outcome.

    probe.placebo_treatment
  • Random common cause

    Python

    Add a variable that causes nothing to the adjustment set. The estimate should barely move.

    probe.random_common_cause
  • Rosenbaum bounds

    Python

    How unequal could the odds of treatment be inside a matched pair before the conclusion stopped being clear?

    probe.rosenbaum
  • Subset stability

    Python

    Re-estimate on random subsets. The answer should move about as much as losing that much data costs, and no more.

    probe.subset
  • Trimming curve

    Python

    Re-estimate across a grid of propensity-score trimming thresholds instead of picking one and hoping.

    probe.trim_curve

Availability describes this release, not whether a method fits your study. R requires a separate installation; the causal-forest adapter also needs grf. The in-app catalogue adds assumptions, diagnostics, options and references to each article.

Desktop, CLI and MCP

Use the desktop studio for the whole study, automate analyses from a terminal, or bring the offline research library into your own assistant.

Desktop studio

Go from a guided example or your own dataset to a design, diagnostics and results. Compare analyses, inspect generated code and build a report without starting from a script.

The Windows x64 app includes Python and its analysis packages. The installer is unsigned. A local browser app is also available from source on Windows, macOS and Linux.

Installation & source setup

Analysis CLI

Create projects, import data, define a specification, inspect diagnostics, get method recommendations and run analyses. Generate R, Python or YAML, validate saved runs and export reports.

After the Python source setup, run these commands from the repository root. The example prints its project path and specification ID for the next steps.

Explore the analysis CLI

Bash · source environment activated

export PYTHONPATH="engines/python:sidecar"
python -m capy_sidecar example medicaid
python -m capy_sidecar engines

# Replace PROJECT and SPEC with the example output.
python -m capy_sidecar sketch PROJECT SPEC
python -m capy_sidecar recommend PROJECT SPEC
python -m capy_sidecar run PROJECT SPEC \
  did.callaway_santanna did.twfe
python -m capy_sidecar scripts PROJECT SPEC --lang r
python -m capy_sidecar report PROJECT SPEC \
  --format markdown
python -m capy_sidecar validate PROJECT

Offline research CLI and MCP

Install capy-knowledge on its own. Search the causal research tree, inspect method requirements and retrieve cited context or audit questions without installing the desktop app or statistical engines.

Connect a project to Codex, Claude Code, Grok Build or Antigravity. The setup command installs the portable research skill and adds the local MCP configuration for your chosen client.

MCP & client setup guide

Python 3.11+ · from the source checkout

python -m venv .venv
# Activate the environment for your shell, then:
python -m pip install './knowledge[mcp]'
capy-knowledge validate
capy-knowledge search "AIPW overlap"
capy-knowledge requirements survival.aft
capy-knowledge coverage --method survival.aft

# Choose your client: codex, claude, grok, antigravity.
capy-knowledge setup-client codex \
  --project /absolute/path/to/your/project

Eight focused MCP tools

Public, offline research knowledge with citations, review status, evidence gaps and a versioned snapshot. The MCP retrieves guidance; statistical execution belongs to the desktop or analysis CLI.

The server has no access to study files, raw data, network retrieval or analysis execution. Your assistant’s own tools and provider settings still apply.

search_knowledge
Find concepts, methods and references.
get_knowledge_node
Inspect a record and its qualifications.
get_source_evidence
Follow a claim to its cited evidence.
traverse_relations
Explore connections in the research tree.
get_method_requirements
Check assumptions and required inputs.
build_research_context
Prepare bounded, cited research context.
get_ontology_coverage
See coverage and remaining evidence gaps.
get_audit_checklist
Retrieve questions for a design review.

Learning resources

Research library

Read 316 standalone articles across designs, methods, probes, estimands, assumptions, diagnostics and studies. Browse without a project or a running engine. Search the literature library, follow publication links and copy bibliographies.

Worked examples

Explore 14 generated worked examples and six simulation templates. Compare bias, RMSE and coverage in worlds where the causal truth is known.

Published studies

Ten real-study datasets can be fetched from their publishers on request and checked against pinned checksums. Data are downloaded when you choose; the app does not redistribute them.

Survival and varying treatment effects

Work with Kaplan–Meier, RMST and censored log-normal or Weibull AFT models. Test heterogeneity across continuous, binary, count/rate, categorical and survival outcomes, with explicit effect scales and direct tests of differences.

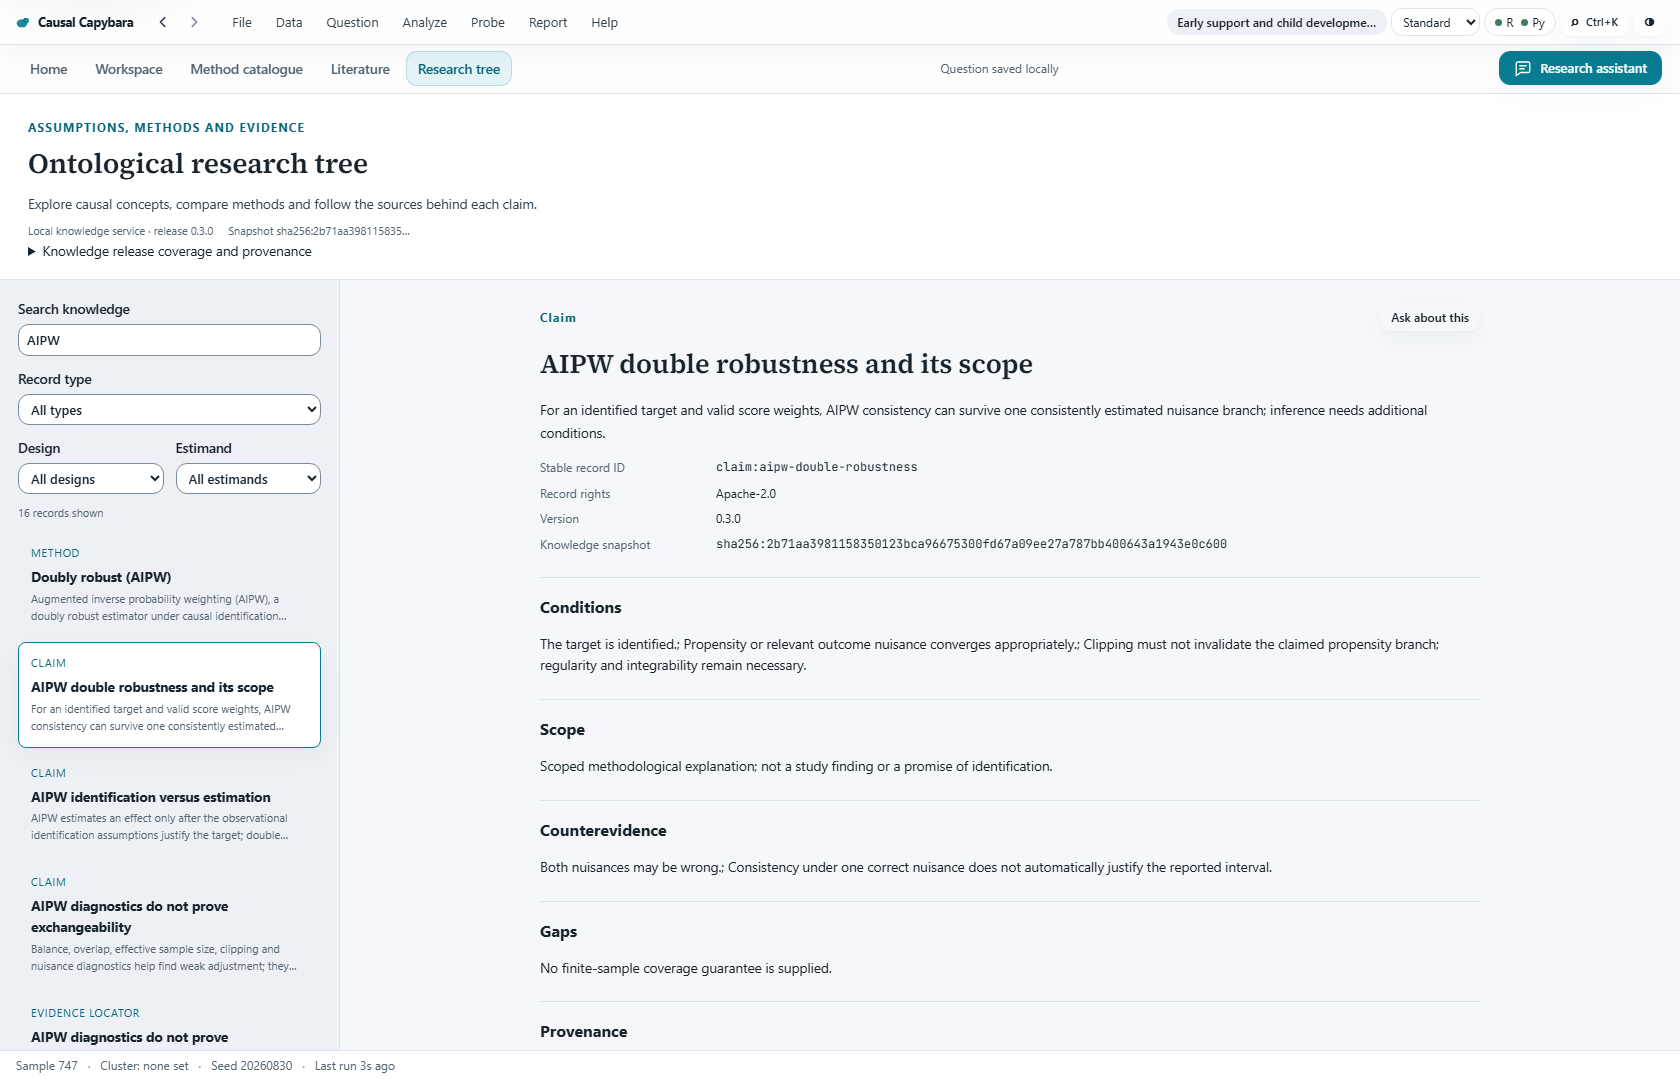
The offline research tree links AIPW to assumptions, concepts, conditions, source records and evidence gaps.
Follow a method to the conditions and evidence behind it.

A research tree with context

Explore 208 concepts, 38 scoped claims and 253 sources. Follow the links between a method, its assumptions, the checks it needs and what the evidence can support.

The same public knowledge is available in the app, the independent CLI and MCP.

Research assistant

Keep locally saved conversations and drafts with each study. Ask about a diagnostic, compare methods or work through a result with cited research context.

Use sources-only retrieval, Ollama, a supported cloud API, or your installed Codex, Claude Code or Grok CLI. Inspect which study summaries, diagnostics, code excerpts and notes you include before sending.

Suggested study changes appear as a reviewable diff. Applying a change and running an analysis require separate approvals.

Explore the research assistant
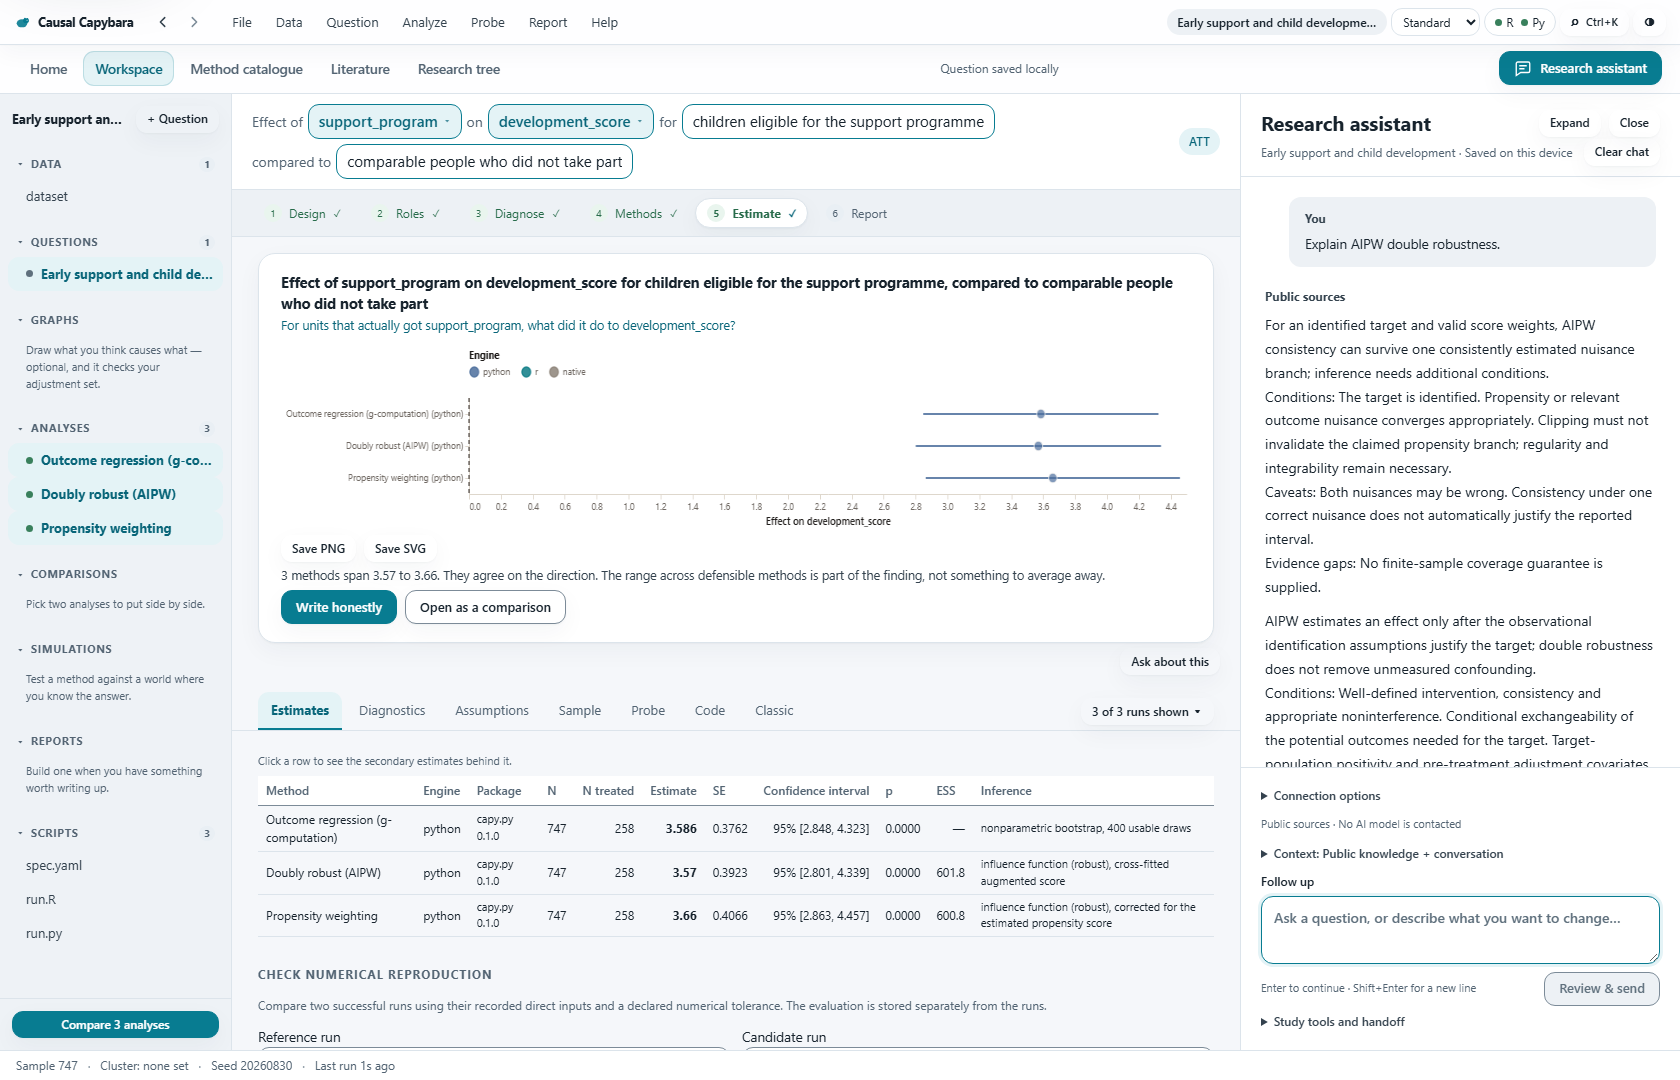
The persistent research assistant beside analysis results, showing a cited sources-only answer without an AI provider call.
A real sources-only response, shown beside generated teaching results.

Questions and answers

Do I need to code or install Python?

The Windows app includes Python and the analysis packages. You can work through the desktop interface without writing code. Source setup and the analysis CLI require your own Python environment; R is optional and installed separately.

Are all 93 catalogue entries runnable?

70 methods and probes run on Python. The remaining 23 are teaching cards that explain methods whose adapters are not yet included. Seven methods also have R adapters. The catalogue labels availability separately from whether a method is appropriate for your design.

Does the MCP run causal analyses?

The MCP retrieves offline public research knowledge: concepts, evidence, requirements, context and audit questions. It does not open your datasets, change studies or fit models. Use the desktop studio or the analysis CLI to run an analysis.

Do my data stay on my computer?

Analysis, projects and locally saved conversations run on your computer. Sources-only retrieval needs no model provider. If you choose a cloud API or cloud-backed CLI, the context you approve is sent to that provider under its own settings and terms.

Can I reproduce and share the analysis?

The workspace stores a versioned study specification and generates R/Python code. Export plots, methodological references and reports in Markdown, HTML or Word; PDF output requires a local TeX toolchain. The CLI can validate saved runs against the result schema.

Can I use it for teaching or institutional work?

Causal Capybara is open source under Apache-2.0, with original code available for inspection and reuse under that license. Third-party components and downloaded datasets retain their own terms. Start with a worked example or contact VCESR about your teaching or research needs.

Download Causal Capybara

Windows app v0.2.0 · unsigned installer

A capybara beside a paper diagram of connected causal nodes.